

Real-time data visualization with javascript
Learn how to use CoinAPI's WebSockets API alongside JavaScript for real-time visualization of cryptocurrency markets.
Real-time data visualization with javascript
Introduction
In this tutorial, we'll demonstrate how to use CoinAPI's WebSockets API alongside JavaScript for real-time visualization of cryptocurrency markets.
We'll use Chart.js, a popular JavaScript library for data visualization.
Prerequisites
- Basic understanding of JavaScript and WebSockets.
- A CoinAPI key (obtainable by signing up on the CoinAPI website).
- Familiarity with Chart.js (Visit the Chart.js documentation for more information).
Visualizing Data with Chart.js
First, we'll create an empty chart using Chart.js.
<!DOCTYPE html>
<html>
<head>
	<script src="https://cdn.jsdelivr.net/npm/chart.js"></script>
    <title>Visualizing Data with Chart.js</title>
</head>
<body>

	<canvas id="myChart"></canvas>

    <script>
		/** part1: chart initialization **/
		const ctx = document.getElementById('myChart').getContext('2d');
		const chart = new Chart(ctx, {
			type: 'line',
			data: {
				labels: [], // This will be populated with timestamps
				datasets: [{
					data: [], // This will be populated with trade prices
					label: 'BTC/USD',
					borderColor: '#3e95cd',
					fill: false
				}]
			},
			options: {
				title: {
					display: true,
					text: 'Real-Time BTC/USD Trade Prices'
				}
			}
		});

		/** part2: below we'll establish ws connection and update the chart with real-time data **/

    </script>
</body>
</html>
The script creates a new line chart with an empty dataset. We'll fill in the data as we receive it from the WebSocket connection in the next step.
Setting Up the WebSocket Connection
We need to set up a WebSocket connection to CoinAPI and update the chart:
/** part2: below we establish ws connection and update the chart with real-time data **/
const socket = new WebSocket('wss://ws.coinapi.io/v1/');
socket.onopen = function (event) {
	socket.send(JSON.stringify({
		"type": "hello",
		"apikey": "YOUR_API_KEY",
		"subscribe_data_type": ["trade"],
		"subscribe_filter_symbol_id": ["BITSTAMP_SPOT_BTC_USD$", "BITFINEX_SPOT_BTC_LTC$"]
	}));
};

socket.onmessage = function (event) {

		const data = JSON.parse(event.data);

		// Add new data to the chart
		chart.data.labels.push(data.time_exchange);
		chart.data.datasets[0].data.push(data.price);

		// Remove the oldest data point if there are more than 50
		if (chart.data.labels.length > 50) {
			chart.data.labels.shift();
			chart.data.datasets[0].data.shift();
		}

		// Update the chart
		chart.update();
};

socket.onerror = function (error) {
	console.log(`WebSocket error: ${error}`);
};
Note: Don't forget to replace YOUR-API-KEY with your actual API key.
Here's the complete code:
<!DOCTYPE html>
<html>
<head>
	<script src="https://cdn.jsdelivr.net/npm/chart.js"></script>
    <title>Visualizing Data with Chart.js</title>
</head>
<body>

	<canvas id="myChart"></canvas>

    <script>
		/** part1: chart initialization **/
		const ctx = document.getElementById('myChart').getContext('2d');
		const chart = new Chart(ctx, {
			type: 'line',
			data: {
				labels: [], // This will be populated with timestamps
				datasets: [{
					data: [], // This will be populated with trade prices
					label: 'BTC/USD',
					borderColor: '#3e95cd',
					fill: false
				}]
			},
			options: {
				title: {
					display: true,
					text: 'Real-Time BTC/USD Trade Prices'
				}
			}
		});

		/** part2: below we establish ws connection and update the chart with real time data **/
		const socket = new WebSocket('wss://ws.coinapi.io/v1/');
        socket.onopen = function (event) {
            socket.send(JSON.stringify({
                "type": "hello",
                "apikey": "YOUR_API_KEY",
                "subscribe_data_type": ["trade"],
                "subscribe_filter_symbol_id": ["BITSTAMP_SPOT_BTC_USD$", "BITFINEX_SPOT_BTC_LTC$"]
            }));
        };

        socket.onmessage = function (event) {

				const data = JSON.parse(event.data);

				// Add new data to the chart
				chart.data.labels.push(data.time_exchange);
				chart.data.datasets[0].data.push(data.price);

				// Remove the oldest data point if there are more than 50
				if (chart.data.labels.length > 50) {
					chart.data.labels.shift();
					chart.data.datasets[0].data.shift();
				}

				// Update the chart
				chart.update();
        };

        socket.onerror = function (error) {
            console.log(`WebSocket error: ${error}`);
        };

    </script>
</body>
</html>
The onmessage event is activated whenever a new message (in our case, trade data) is received from the server.
The message data is in JSON format, which we convert to a JavaScript object with JSON.parse().
Our chart now updates in real time as we receive trade data from CoinAPI!
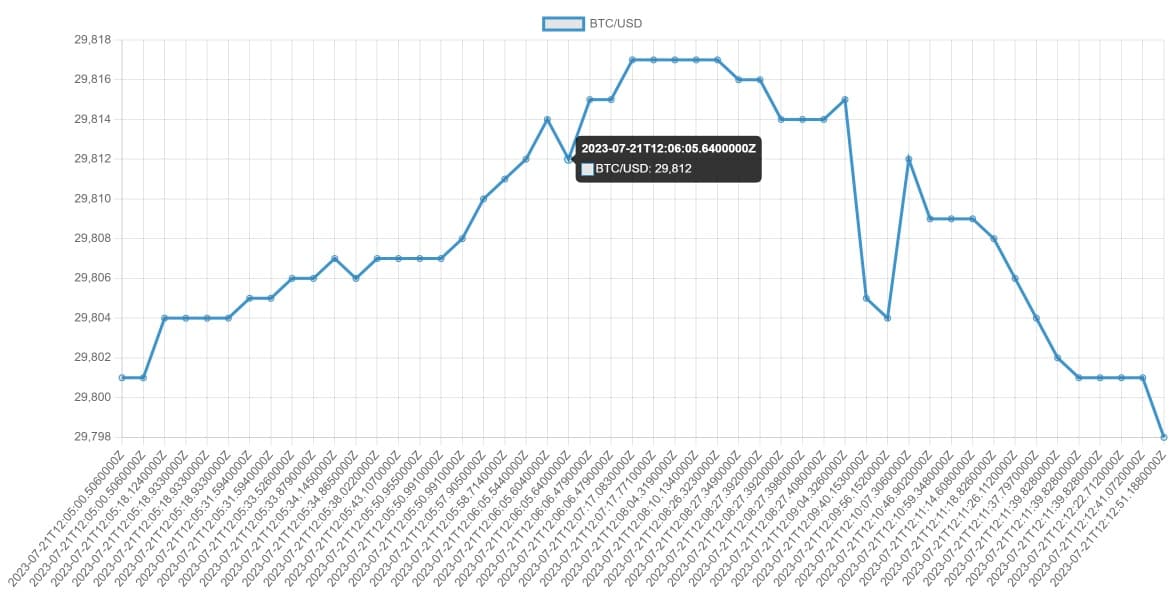
You're now equipped to use CoinAPI with JavaScript for real-time data visualization. Dive into the dynamic world of cryptocurrencies and explore with these powerful tools at your disposal. Happy coding!
Import data to Google Sheets/Excel
Learn how to extract market data in CSV format and import it into Google Sheets or Microsoft Excel.
Real-time trades stream using WebSocket with different languages
Learn how to subscribe to real-time cryptocurrency market data using CoinAPI WebSocket protocol in Python, JavaScript, and Java.